Article of the Month - April 2025
|
Artificial Intelligence for Querying Land and
Property Data from Cadastral Plans
Hamid Hosseini, Behnam Atazadeh and Abbas
Rajabifard, Australia
 |
 |
 |
| Hamid Hosseini |
Behnam Atazadeh |
Abbas Rajabifard |
This article in .pdf-format
(16 pages)
SUMMARY
Cadastral plans are used in land registration systems for defining
legal boundaries of land parcels and properties as well as their
associated rights, restrictions, and responsibilities (RRRs). However,
existing registered cadastral plans are in 2D non-machine-readable
formats and data within these plans are not easily accessible and
readily usable, leading to unnecessary delays, disruptions, and costs
within land development projects. Artificial intelligence (AI) as an
emerging technology has been recognized as one of the operational
parameters for advancing land administration systems (LASs) which can
offer transformative solutions to overcome traditional approaches. This
paper presents a new approach to efficiently retrieve land and property
information from cadastral plans, reducing the high cognitive load
associated with manual approaches. Our approach’s two core
functionalities are data extraction from plans using computer vision and
communication with plans using natural language processing (NLP). To
demonstrate our approach, a prototype chatbot employing generative
pretrained transformer (GPT) as the core large language model (LLM) was
developed for data querying from plans. Initial testing shows effective
handling of semantic queries, while highlighting the need for further
refinement and development in handling more specific queries within land
administration domain and complex spatial queries.
1. INTRODUCTION
Effective management of land and property data during its lifecycle
is significantly important for the operational efficiency of four
critical land administration functions: land ownership, value, use, and
development. This results in promoting economic development,
environmental sustainability, and social well-being in all jurisdictions
and countries (Williamson et al., 2010). Considering land ownership as
the basis for the next administrative activities, cadastral plans are
common data used for defining and registering boundaries of land parcels
and properties as well as their associated rights, restrictions, and
responsibilities (RRRs). In Victoria, Australia, plan of subdivision
(PS) and plan of consolidation (PC) are currently used to document and
represent legal information about the ownership and extent of RRRs over
land parcels and properties. In addition to PSs and PCs, abstract of
field records (AFRs) are used for documenting and representing the
required survey information such as land parcels’ connection to a road
intersection or a Crown boundary for generating new plans (Land Use
Victoria, 2024b). Any land transaction such as subdivisions,
consolidations, and boundary realignments involving new legal boundaries
or modifying existing boundaries must be supported by performing land
surveying and land registration activities to issue new titles for the
new land parcels. These plans are used by relevant stakeholders involved
in all stages of land development projects from initial design to future
maintenance and form the backbone of various land administration
processes such as back-capturing and examination.
However, existing registered cadastral plans are in 2D
non-machine-readable formats such as papers and scanned documents which
have static representation and lack intelligence. These plans provide
essential land and property information. However, due to the special
characteristics of these plans, administrative, legal, and survey data
within these plans are not easily accessible and readily usable, leading
to insufficient data queries. The most apparent characteristics of these
plans are (see Figure 1):
- Dense and detailed data: Each sheet of the plans contains dense
and detailed textual elements (e.g., characters, numbers, and
punctuations) in multiple sizes and orientations as well as
geometric elements (e.g., symbols, lines, polygons). Although it
provides rich and comprehensive understanding, it leads to
difficulties in finding specific land and property information
quickly.
- Fragmentation: Data inside these plans are fragmented and
scattered not only across multiple sheets but also throughout
individual sheets. Although it directs attention to a specific
portion of the plan’s information, it makes it difficult to follow
the content coherently and may cause to miss critical land and
property information.
- 2D flat view: Elevation and depth information which is essential
for representing the vertical dimension is provided by 2D flat
viewed diagrams such as crosse-sectional and isometric diagrams,
leading to ambiguity in terms of visualisation.
- Isolation: Considering two or more land parcels and properties,
their own plans are stored separately, leading to difficulties to
find out their relationships in an integrated
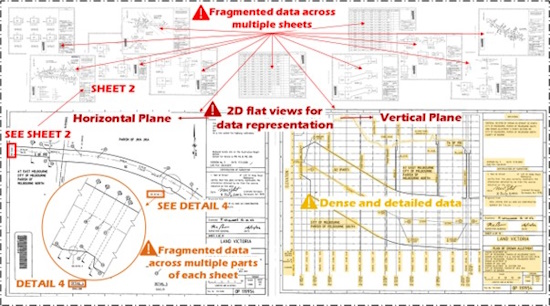
Figure 1. A Crown plan of a tunnel in the city of
Melbourne with its characteristics in static PDF format, leading to
increasing much cognitive load to understand the content
Overall, a much cognitive load is required to understand the content
inside cadastral plans and therefore query desired data, especially for
less experienced users with less familiarity with the content, leading
to a reduction in the level of accessibility and usability of these
plans. This can potentially result in slow and inefficient
administrative processes which can lead to unnecessary delays,
disruptions, and costs within land development projects, particularly in
large-scale infrastructure projects which deal with numerous land
parcels and properties.
Transforming data from 2D non-machine-readable formats to 3D full
digital models based on Land Administration Domain Model (LADM), City
Geography Markup Language (CityGML), and Industry Foundation Classes
(IFC), few studies have been conducted for connecting LADM and IFC
(Atazadeh et al., 2018), integration of LADM and CityGML (Góźdź et al.,
2014; Li et al., 2016), and 3D-extending the CityGML for underground
legal boundaries (Saeidian et al., 2024). However, the majority of
existing registered land and property data have yet to be mapped into
these newly developed 3D digital models. In Victoria, Australia,
although many plans have converted to digital records (i.e., LandXML)
within the back-capturing process under the Digital Cadastre
Modernisation program (Land Use Victoria, 2024a), this initiative
currently does not support multi-story properties (Cumerford, 2010).
Considering the process of mapping, it is a semi-automated task
requiring domain experts and is not usable by non-specialist
stakeholders. In addition, conducting new surveys is both time-consuming
and costly, and using crowdsourcing approaches may fail in terms of
accuracy and heterogeneity.
Applying innovative and efficient ways to enhance the reusability of
the existing data can potentially benefit stakeholders such as land
surveyors and land registries, facilitating access to and retrieval of
land and property information for different purposes. The new
intelligent approaches should be able to review the plans quickly and
generate query results faster, assisting stakeholders to make smarter
decisions with reduced cognitive effort. Artificial intelligence (AI)
has been recognized as one of the operational parameters for advancing
land administration systems (LASs) (Chehrehbargh et al., 2024). AI has
been widely adopted in various domains such as geospatial science and
has resulted in the emergence of geospatial AI (GeoAI). The adoption of
AI into land administration, as a subdomain of geospatial science, can
offer intelligent solutions to overcome traditional approaches within
land administration practices. By developing AI models, it becomes
possible not only to review and query from plans directly but also to
accelerate their conversion to 3D digital models and hence effective
data validation, storage, visualisation, and query. This is in line with
the future visions defined in the Cadastre 2034 initiative which has a
vision to enable people to understand their RRRs related to land and
real property in a survey accurate and 3D environment. The aim of this
initiative is to achieve a cadastral system which is sustainably
managed, truly accessible, easily visualised, readily used, fully
integrated with broader interests on land and provides a dynamic, 3D
digital representation of real world (ICSM, 2019).
The main purpose of this paper is to introduce a new AI-based approach
to support land administration stakeholders in querying land and
property data from existing registered cadastral plans in an intelligent
environment using computer vision and natural language processing (NLP).
This is expected to increase the efficiency of the document reviewing
process and assist the stakeholders to conduct land administration tasks
with considerably less cognitive load. To demonstrate the practical
applicability of our approach, an initial prototype of a chatbot has
been developed and tested in which users can upload a cadastral plan in
PDF format and ask questions about the plan in a natural language form
and receive a response accordingly. This serves as a proof of concept,
illustrating how AI can transform traditional land administration
processes, making cadastral plans more accessible and reusable.
The rest of the paper is organised as follows: Section 2 provides the
background relevant to the research. In Section 3, the proposed approach
is described. In Section 4, an initial prototyping and testing has been
conducted to examine the feasibility of the proposed AI-based approach
for querying land and property data. Finally, Section 5 provides
discussions and conclusions.
2 BACKGROUND AND RELATED WORK
2.1 Artificial Intelligence
Although AI lacks a universally accepted definition, it is generally
recognized as enabling machines to replicate different aspects of human
intelligence such as reasoning, learning, perceiving, communicating,
problem-solving, and acting (Russell & Norvig, 2016). This can lead to
learning from experience, adapting to new situations, and performing
human-like tasks (Duan et al., 2019). It involves a wide range of
techniques that can broadly be categorized into rule-based and
data-driven paradigms. Reasoning aspect of human intelligence refers to
the process of human-like logical thinking. Expert systems are popular
example of AI developments related to reasoning aspect in which explicit
knowledge in form of encoded if-then rules is used (Gupta & Nagpal,
2020). As computational power grew, this rigid approach has been
replaced by data-driven approaches which are based on learning from
data. Although it has less transparency, it brings more flexibility and
adaptability to new situations. Machine learning algorithms such as
decision trees, random forest (RF), support vector machine (SVM), and
k-means can be fed with experienced data and be trained and make
predictions for new data (Zhou, 2021). More advanced, deep learning as a
subset of machine learning can extract deep patterns from data through
its multi-layer neural network (Goodfellow, 2016). Moreover, computer
vision and natural language processing (NLP) can replicate human
cognition aspects such as vision and speech. Computer vision can
perceive and understand visual information and has shown its
capabilities for information extraction from imagery data such as plans.
On the other hand, NLP can potentially understand and generate
information in for of human language such as textual data (Nishant et
al., 2020). Leveraging these techniques, AI offers three main
capabilities: 1) automation 2) real-time functionality and prediction 3)
intelligent decision-making.
Optical character recognition (OCR) is a technology used to identify
and convert textual data form different types of documents, such as
scanned papers and PDFs into machine-readable format (Memon et al.,
2020). OCR for survey plan analysis automates the extraction of textual
information, such as boundary descriptions, parcel numbers, and surveyor
annotations, from scanned survey documents. Traditional OCR used pattern
recognition techniques and rule-based approaches but data-driven OCR
like those powered by convolutional neural networks (CNNs) can handle
more complex tasks, such as identifying text in varied fonts, layouts,
and even handwriting. These systems learn from large datasets and
continuously improve their accuracy and efficiency through AI models. By
converting survey plans into machine-readable textual formats, OCR
streamlines land tenure documentation. This automation enhances the
efficiency of land administration tasks, reducing manual data entry and
errors.
Upon extraction of textual information from plans, these raw texts need
to be processed to be converted into computer-intelligible (i.e.,
numerical) format (Chen et al., 2022). Moreover, for having enhanced
communication with the plans, generating new textual data is required.
These can be done using NLP and large language models (LLM). NLP
consists of preprocessing tasks for cleaning the text and vectorization
of words for converting the text into numerical format. Preprocessing
consists of several steps as follows:
- Removing unnecessary data: It refers to
removing punctuation, HTML tags, etc.
- Tokenization: It refers to splitting text into
smaller units such as words or sentences.
- Normalization: It refers to standardizing text
by converting all characters to lowercase and normalizing spelling.
- Removing stopwords: It refers to removing words
that do not contribute much meaning (e.g., the, and, or).
- Stemming and lemmatization: Stemming refers to
reducing words to their base or root form and lemmatization refers
to mapping words to their dictionary form.
In order to convert the prepossessed text to machine- readable
format, the text needs to be converted into numerical format (i.e.,
vector representation), known as embedding vectors. Bag of Words (BoG)
(Rani et al., 2022) is a traditional model for word embedding which
relies on the frequency of word occurrences but lacks contextual
awareness, resulting in semantic inaccuracy. In contrast, Word2Vec
(Mikolov et al., 2013) and GloVe (Pennington et al., 2014) are
predictive models based on learning concept. GloVe captures global
context across the entire corpus and is more suitable for representing
semantic relationships. However, these models are static and assign a
single vector representation to a word regardless of its context. On the
other hand, transformer-based word embedding methods such as embeddings
from language models (ELMo) (Peters et al., 2018), bidirectional encoder
representations from transformers (BERT) (Devlin, 2018), and generative
pretrained transformer (GPT) (Brown, 2020) excels in contextual
embedding in which dynamic vectors as the output adapting to the context
are generated. These methods are based on transformer architectures
which use self-attention mechanism to achieve a deeper understanding of
contextual relationships (Vaswani, 2017). Self-attention mechanism
allows each word to attend to all other words in the sequence and
generate a set of context-sensitive vectors for each word, enriched with
weighted information from other words in the sequence. The relevance of
tokens to one another is quantified through attention scores which is
calculated by using the dot product of query and key vectors, followed
by a softmax operation for normalisation. Considering LLM models for
generating new textual data related to a given text, the embeddings are
updated and refined layer by layer within the transformer. Once the
sequence has been processed, the new textual data is generated by
selecting the next word based on the highest probability from the
softmax output. This new textual data may include summaries or answers
to specific queries about the input text.
2.2 Related Work
Several studies have been conducted for information extraction from
cadastral document. In (Lenc et al., 2021), fully convolutional networks
(FCNs) has been developed for landmark and border line detection
combined with traditional image processing techniques like edge
detection for facilitating the creation of maps from historical
documents. Applicability of neural networks for effective annotation in
historical maps to facilitate their automatic vectorization is discussed
in (Petitpierre & Guhennec, 2023). In (Lenc et al., 2023), integration
of neural networks with standard computer vision techniques for the
automatic analysis of historical cadastral maps has been suggested when
little training data are available. In (Mango et al., 2023), line
convolution neural network (LCNN) and ResNet-50 have been used for
detecting parcels and their numbers in paper-based cadastral data,
respectively. However, it is unable to detect all numbers. In a similar
study (Marcial et al., 2013), lot numbers have been recognized using
artificial neural network (ANN) and image processing techniques like
binarization. The study achieved an average detection rate of 90% for
smaller maps and 84.78% for larger maps.
In (Franken et al., 2021), a data processing platform named VeCToR has
been developed that combines deep learning algorithms with human
validation for high accuracy in the extraction of geometric and semantic
information from millions of historical field sketches which are
schematic drawings and different from cadastral plans, aiming to rebuild
cadastre maps of Netherland. Conversion of AFRs files into LandXML files
using OCR process has been investigated in (La Rosa & Garrido, 2019). In
(Yıldız et al., 2021), a model has been developed to automatically
digitize the temporal dimension of cadastral parcels using OCR and EAST
DL text detectors. However, it has challenges with ambiguous texts,
light reflections, and blurry images. Overall, deep learning models can
achieve excellent performance in cadastral map digitization, but the
limited training data is a big challenge, especially for historical maps
(Ignjatić et al., 2018).
3. PROPOSED AI-BASED APPROACH
Considering the issues associated with 2D survey plans and the
transformative solutions that AI brings to us, a conceptual framework
with an architecture has been introduced which is illustrated in Figure
2. The flow begins with user interactions, where users can upload survey
plans in raster PDF formats. Then they can input queries seeking
specific information such as depth limitation or distance between two
specific points ensuring accessibility and ease of communication,
regardless of their technical background. Based on the uploaded plans
and input queries, users can receive a coherent response in natural
language. This framework is underpinned by two core functionalities:
data extraction from plans using computer vision and communication with
plans using NLP, which are described in the following subsections.
3.1 Textual and geometric data extraction from plans
Through this functionality, the uploaded plans undergo conversion to
an image format such as PNG to be prepared for extracting essential data
from them. Once the sheets of the plan are converted to an image format,
key components within each image, such as notations and boundaries, need
to be identified and segmented using computer vision techniques. In this
regard, an essential component of the process is the utilization of
CNNs, which excel in image segmentation tasks by providing a precise and
detailed examination of the details present in survey plans. These
networks perform a thorough and detailed analysis of the various
elements present in the survey plans, ensuring that all textual and
geometric components are captured and ready for further analysis. The
output is a segmented image in where each pixel is classified into
distinct categories such as annotation, boundary, and other relevant
features. Following the segmentation process, textual data within the
segmented image regions containing texts are extracted and transcribed
from image format into machine-readable text using OCR engines. This
results in raw textual output being stored in a database or in a file
format like LandXML. Simultaneously, geometric data from the survey
plans are extracted and converted into structured formats like Geo
JavaScript Object Notation (GeoJSON) which leads to representing and
storing spatial data. Overall, this functionality ensures that both
textual and geometric information are systematically extracted, stored,
and made readily available for further analysis.
3.2 Textual query processing and response generation for users
Through this functionality, interaction between users and plans is
enhanced. User queries which are in natural language need to be analysed
and interpreted in a way that allows machines to understand. In this
regard, a fine-tuned LLM based on pretrained LLMs such as GPT must be
applied to handle the queries. In fact, the NLP component bridges the
gap between the extracted textual and geometric data and the natural
language queries submitted by surveyors. LLM, specifically trained on a
purpose-built dataset of surveyor queries related to survey plans and
corresponding answers, can potentially accommodate various queries. The
queries can be a straightforward semantic query that its corresponding
answer has been explicitly stated within the plan (e.g., what is the
reduced level of point no. 123?) or more complex spatial query (e.g.,
what is the distance between point no. 123 and no. 124?).
First, the query is classified to find out whether it is semantic or
spatial before accessing the structured database. This classification is
conducted using supervised learning algorithms. After classification,
the query is converted to a structured format like JSON to facilitate
the retrieval of information that has been extracted and stored in a
database before. Upon receiving results from the database, as these
outputs are often presented in a structured format and may not be
familiar for the user, the information is converted back into a natural
language format using the fine-tuned LLM, providing a description of the
result. Moreover, if the query contains both semantic and spatial
components, the query is sent to a developed spatial reasoning model to
perform spatial calculations. This component primarily uses symbolic
reasoning such as if-then rules and algorithms (e.g., topological
operators, metric operators, and directional operators) to process
structured geometric data and it does not use data-driven approaches.
The output might be precise spatial measurements or analysis results
that can be integrated into the final response provided to the user.
Finally, the user receives relevant responses.
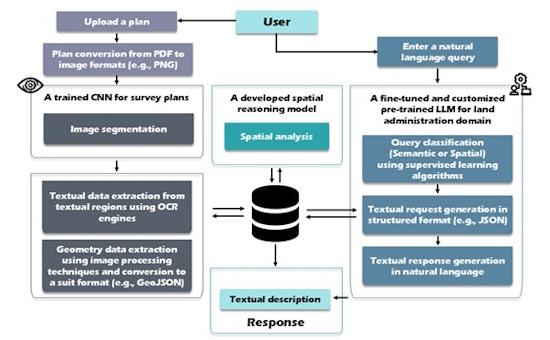
Figure 2. The proposed architecture for design of
the prototype
4. INITIAL PROTOTYPING AND TESTING
To prove the concept, an initial prototyping was conducted to test
the feasibility of data querying from plans that include complex spatial
layouts and semantic annotations using AI technologies. The prototype
took the form of a web-based chatbot developed using Python programming
language in which GPT-3.5-Turbo was employed as the core LLM. To have a
customized LLM, we utilized retrieval-augmented generation (RAG)
techniques, which combine generative capabilities with the ability to
access external information sources, significantly improving the
accuracy and relevance of responses in land administration scenarios. In
this method, the output of a pretrained LLM is optimized by referencing
an external knowledge base outside of the LLM training data sources
before generating a response. First, the embeddings vectors of the
stored chunks (i.e., paragraphs) are first generated in a pre-trained
LLM. The embedding vector of user’s prompt is first generated and the
similarity between the user’s prompt and the stored paragraphs’
embedding vector is then calculated to retrieve the most relevant
contexts. We used cosine similarity method and Oracle database
containing 1901 paragraphs extracted from scientific papers in different
sources such as Land Use Policy journal, organizational reports such as
FIG and CSDILA reports and papers, and governmental publications such as
resources in Land Use Victoria and Victorian legislation. The most
relevant contexts are then combined with user’s prompt and a
comprehensive prompt is formed as an input for the pretrained LLM.
Responses will be generated tailored to land administration domain that
enhances the responses of the pretrained LLM and reduces the occurrence
of hallucinations, thereby increasing the models’ credibility. The
interface of the developed prototype is depicted in Figure 3. It
includes a drag-and-drop file upload feature that allows users to upload
survey plans in PDF format. Also, a textbox is considered that lets
users type questions related to the uploaded plan and then click the
submit button to process the query, which triggers the system to extract
and interpret relevant information from the plan and generates suitable
response, which is then displayed the chatbot response textbox,
providing users with the requested information in real time.
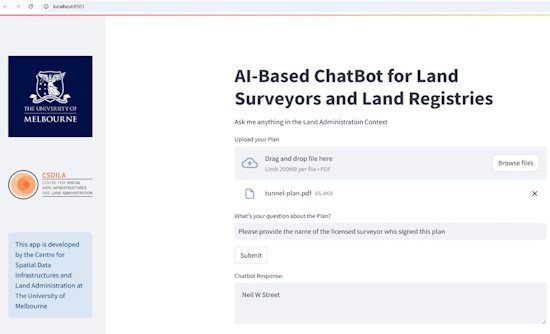
Figure 3. The interface of the developed prototype
To evaluate the prototype, it was then tasked with answering targeted
questions to test its ability to understand semantic content and spatial
relationships within survey plans. The performance is assessed based on
the model’s accuracy/correctness in identifying and interpreting data
such as boundaries, annotations, and any semantic notes within the
survey plans. The testing phase used various semantic and spatial
queries derived from the Crown plan depicted earlier in Figure 1 as a
case study. The prototype’s responses were then evaluated and compared
against the expected results. Several queries were executed on a plan,
with specific portions utilized for testing, as illustrated in Figure 4.
The detailed queries and corresponding responses generated by the
prototype are shown in Tables 1 and 2. This evaluation highlights the
steps necessary to achieve greater robustness in real-world applications
in processing survey data queries.
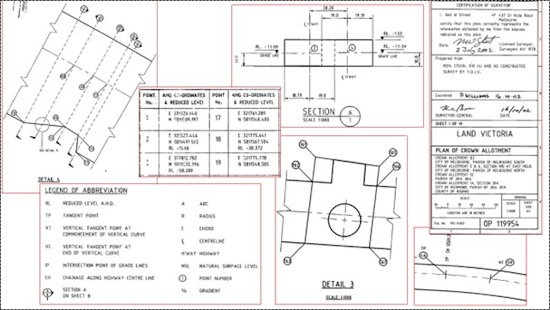
Figure 4. Some parts of a Crown plan as initial data
for testing and evaluation
Table 1. Semantic queries and corresponding
responses
Query
|
Response
|
Accuracy score
|
|
Is this a plan of subdivision or a plan of
consolidation?
|
This document is a plan of subdivision. The plan shows
the division of Crown Allotments into smaller parcels. The
legend indicates "Crown Allotment" and details of the
subdivision of those allotments.
|
0
|
|
What is the plan number? What is the edition of
plan? What is the number of the crown allotment?
|
The plan number is OP 119954. The edition of the plan is
3. The crown allotment number is Q2.
|
100
|
|
What is its city, parish, and country?
|
The plan shows the City of Melbourne and the City of
Richmond, Parishes of Melbourne South, Melbourne North, and Jika
Jika, all located in the County of Bourke. The country is not
explicitly stated on the plan, but given the other details, it's
implied to be Australia.
|
100
|
|
Which datum is used for reduced level?
|
The Australian Height Datum is used for the reduced levels.
|
100
|
|
Who is the Licensed Surveyor?
|
Neil W Street of 437 St Kilda Road, Melbourne is the Licensed
Surveyor.
|
100
|
|
Who is the Surveyor-General?
|
P. Williams is the Surveyor-General
|
0
|
|
Who is the examiner?
|
P. Williams examined the plan.
|
100
|
|
On what date was it signed, and by whom?
|
The plan was signed on July 3, 2002, by Neil W. Street.
|
50
|
|
What is the scale of the map?
|
The main plan scale is 1:3000. There are also details at
scales of 1:500, 1:1000, and 1:750 and 1:10. One vertical
section is at 1:5000 and another is at 1:5500.
|
100
|
|
What does CH mean in the legend abbreviation?
|
CH stands for Chainage along the Highway Centre Line.
|
100
|
|
How is the parcel shown?
|
The parcel is shown by continuous thick lines.
|
100
|
|
What is the CAD file number of sheet 2?
|
The CAD file number for Sheet 2 is SGLA5228.
|
100
|
|
How many sheets does it have?
|
The plan consists of 19 sheets. There is also a
modification table as a 20th sheet.
|
100
|
|
How many abbreviations are there in the legend?
|
There are eight abbreviations in the legend.
|
0
|
Table 2. Spatial queries and corresponding responses
Query
|
Response
|
Accuracy score
|
|
What are the coordinates of point numbers 17 and
19?
|
Point 17: E 321761.289, N 5811548.400, RL -16.601 Point
19: E 321775.778, N 5811548.505, RL -38.372
|
50 (Do not have RL)
|
|
What is the distance between point numbers 17 and
19?
|
I cannot calculate the precise distance between points 17
and 19. While the Easting and Northing coordinates are provided,
I lack the information necessary to perform a coordinate
transformation to accurately compute the distance in meters.
This would require knowing the map projection used (e.g., UTM,
State Plane) and potentially applying a more complex calculation
than a simple Euclidean distance. To obtain the distance, you
would need to use a Geographic Information System (GIS) or
specialized software that incorporates the necessary projection
information.
|
Can not
|
|
Which points have the vertical dimension within
their coordinates?
|
The points listed in the coordinate table on Sheet 18 and
Sheet 19 include a "RL" value alongside their Easting and
Northing coordinates. "RL" stands for Reduced Level, which
represents the vertical dimension (elevation). Therefore, all
the points listed in those tables (points 1 through 172) have a
vertical dimension included in their coordinate information.
|
0
|
|
What is the RL of point number 1?
|
The RL of point number 1 is -5.398.
|
0
|
|
Tell me which point have RL?
|
I cannot definitively identify which points have RL
values without a more thorough and systematic review of the
tables on sheets 18 and 19. The OCR results are not perfectly
clean and may have missed some RL values, or they may be
inconsistently formatted. A manual inspection of the original
scanned document is required to confirm which points include RL
data.
|
Can not
|
|
Is point number 59 a VC or TP?
|
Point number 59 is a VC (Vertical Curve Tangent Point).
|
100
|
|
Which type of map scale is used? Linear or ratio?
|
The map uses a ratio scale. A ratio scale (also called a
representative fraction) expresses the scale as a ratio, such as
1:3000, meaning one unit on the map represents 3000 units on the
ground. This is different from a linear scale which uses a
visual bar to show the scale. While the document includes a
linear representation of the scale, the fundamental scale used
is expressed as a ratio.
|
50 (It is not correct for the scale on the right side of the
sheets)
|
|
What does DETAIL 4 show?
|
DETAIL 4 shows a cross-section view of a portion of the
highway and surrounding area, focusing on the area around point
numbers 113-117. It highlights the relationship between the
highway, the natural surface level, and other details of the
subsurface. The detail drawing provides measurements and levels
relevant to this specific part of the project.
|
0
|
|
Is DETAIL 4 a horizontal map or vertical?
|
DETAIL 4 is a vertical cross-section. It shows a slice
through the earth, revealing the vertical relationships between
the highway, the ground surface, and other features at that
location. It's not a horizontal plan view which would show the
spatial layout from above.
|
0
|
|
Is SECTION A/1 a horizontal map or vertical?
|
SECTION A/1 is a vertical cross-section. The drawings
labelled "SECTION" in this document are all vertical
cross-sections showing subsurface details and elevations, not
horizontal plan views.
|
100
|
|
How many points are observed in DETAIL 3?
|
DETAIL 3 shows seven numbered points: 153, 154, 155, 157,
161, 163, and 165.
|
0
|
|
How many parcels are there?
|
Crown Allotment Q2
Crown Allotments 5 & 6, Section 19D
Crown Allotment 5C
Crown Allotment 1A, Section 39A
|
0
|
|
Is there any easement within this plan?
|
The provided document does not explicitly mention
easements. While the plans show various features and boundaries,
there is no text or notation that clearly indicates the presence
of easements. To determine whether easements exist, you would
need to consult additional documentation related to the land
title or other legal records associated with these parcels.
|
Can not
|
|
Where is the boundary of parcel Q2?
|
The boundary of parcel Q2 is shown as a thick continuous
line on the provided maps, encompassing an area that extends
along the Yarra River. The exact coordinates of the boundary are
not explicitly listed, but the boundary is defined by the series
of points and curves shown on sheets 1, 2, 3, 4 and 5. The
boundary follows both sides of the Yarra River and is impacted
by the highway (as the parcel is a stratum of crown land).
|
0 (Only in sheet 1)
|
|
With which points does Crown Allotment Q2
intersect? Please list the points that define its perimeter.
|
I cannot provide a complete list of points defining
Parcel Q2's perimeter. The maps are complex, and a precise
identification requires a manual inspection of the drawings
themselves. The OCR data provides the coordinates of many points
but does not explicitly connect those points to Parcel Q2's
boundary in every case. To create the complete list, one would
need to manually trace the boundary line on the maps and note
the numbers of the points it passes through.
|
Can not
|
5. DISCUSSION AND CONCLUSION
In this paper, a novel method based on AI as an emerging technology
has been proposed for retrieving information from cadastral plans,
aiming at overcoming limitations associated with the plans, such as
fragmentation, and hence decreasing high cognitive load associated with
traditional manual analysis. Our proposed framework addresses the
challenges by leveraging cutting-edge AI technologies, specifically
computer vision techniques for image processing, OCR for text extraction
from the plans, and NLP and LLMs to facilitate query processing and
response generation. This approach significantly streamlines the data
access and allows quick retrieval of information from cadastral plans.
Results from the initial testing phase show that the developed
prototype can effectively handle semantic queries explicitly defined
within the plans. However, more extensive fine-tuning is needed to
enhance LLMs’ capabilities in handling land administration
domain-specific queries. Moreover, the performance of the prototype
decreased when dealing with spatial queries. While it could extract
spatial coordinates of points, it cannot perform the necessary spatial
calculations or contextual understanding to provide meaningful spatial
insights. This indicates a need for employing spatial analysis tools to
provide the chatbot with accurate spatial reasoning. In summary, the
prototype demonstrates potential for automating document analysis,
especially for simple fact-extraction tasks. However, improvements are
needed to enhance the chatbot’s ability to understand implicit
information and infer relationships between different parts of the
document which can potentially lead to more accurate and complete
responses.
Regarding improvement of the current state, high-quality data is
required for training algorithms to make accurate predictions within
different components of the prototype which is a critical area for
future research. High-quality data leads to ensure the developed AI
models can recognise and interpret various textual and geometric
elements within these plans, such as legal boundaries, survey
observations, and administrative information. Moreover, the performance
of the models in handling new situations in different survey use cases
is significantly related to the diversity of the datasets and various
land administration concepts such as legal boundaries and spaces, survey
measurements, and land administration terminologies must be clarified.
Hence, standardized data and processing protocols are required to create
larger, more consistent, and comprehensively annotated datasets for
model training. Additionally, to address data privacy concerns, we
propose to use on-device LLMs, such as Llama, instead of cloud-based
alternatives like GPT. By addressing these challenges and further
developing the prototype, the efficiency and effectiveness of survey
information retrieval can be dramatically improved, leading to enhance
the robustness of AI-driven solutions for land administration purposes.
REFERENCES:
-
Atazadeh, B., Rajabifard, A., & Kalantari, M. (2018). Connecting
LADM and IFC standards–pathways towards an integrated legal-physical
model. The 7th International FIG Workshop on the Land Administration
Domain Model, Zagreb, Croatia.
-
Brown, T. B. (2020). Language models are few-shot learners. arXiv
preprint arXiv:2005.14165.
-
Chehrehbargh, F. J., Rajabifard, A., Atazadeh, B., & Steudler, D.
(2024). Identifying global parameters for advancing Land
Administration Systems. Land use policy, 136, 106973.
-
Chen, X., Xie, H., & Tao, X. (2022). Vision, status, and research
topics of Natural Language Processing. In (Vol. 1, pp. 100001):
Elsevier.
-
Cumerford, N. (2010). The ICSM ePlan protocol, its development,
evolution and implementation. FIG congress, Sydney, Australia.
-
Devlin, J. (2018). Bert: Pre-training of deep bidirectional
transformers for language understanding. arXiv preprint
arXiv:1810.04805.
-
Duan, Y., Edwards, J. S., & Dwivedi, Y. K. (2019). Artificial
intelligence for decision making in the era of Big Data–evolution,
challenges and research agenda. International journal of information
management, 48, 63-71.
-
Franken, J., Florijn, W., Hoekstra, M., & Hagemans, E. (2021).
Rebuilding the cadastral map of The Netherlands, the artificial
intelligence solution. FIG working week, Amsterdam, Netherlands
-
Goodfellow, I. (2016). Deep learning. In: MIT press.
-
Góźdź, K., Pachelski, W., van Oosterom, P., & Coors, V. (2014).
The possibilities of using CityGML for 3D representation of
buildings in the cadastre. Proceedings of the 4th International
Workshop on 3D Cadastres Workshop, Dubai, United Arab Emirates.
-
Gupta, I., & Nagpal, G. (2020). Artificial intelligence and
expert systems. Mercury Learning and Information.
-
ICSM. (2019). Cadastre 2034-Powering Land & Real Property.
https://www.icsm.gov.au/sites/default/files/Cadastre2034_0.pdf
-
Ignjatić, J., Nikolić, B., & Rikalović, A. (2018). Deep learning
for historical cadastral maps digitization: Overview, challenges and
potential. Comput. Sci. Res. Notes 2803, 42-47.
-
La Rosa, D., & Garrido, O. (2019). Conversion of Cadastral Survey
Information into LandXML Files using Machine Learning University of
Southern Queensland].
-
Land Use Victoria. (2024a). Digital Cadastre Modernisation.
https://www.land.vic.gov.au/surveying/projects-and-initiatives/digital-cadastre-modernisation
-
Land Use Victoria. (2024b). Plans of subdivision and
consolidation.
https://www.land.vic.gov.au/land-registration/for-professionals/plans-of-subdivision-and-consolidation
-
Lenc, L., Baloun, J., Martínek, J., & Král, P. (2023). Towards
Historical Map Analysis Using Deep Learning Techniques. 19th IFIP
International Conference on Artificial Intelligence Applications and
Innovations, León, Spain.
-
Lenc, L., Prantl, M., Martínek, J., & Král, P. (2021). Border
detection for seamless connection of historical cadastral maps.
Document Analysis and Recognition–ICDAR 2021 Workshops: Lausanne,
Switzerland, September 5–10, 2021, Proceedings, Part I 16,
-
Li, L., Wu, J., Zhu, H., Duan, X., & Luo, F. (2016). 3D modeling
of the ownership structure of condominium units. Computers,
environment and urban systems, 59, 50-63.
-
Mango, J., Wang, M., Mu, S., Zhang, D., Ngondo, J.,
Valerian-Peter, R., Claramunt, C., & Li, X. (2023). Transform
paper-based cadastral data into digital systems using GIS and
end-to-end deep learning techniques. International Journal of
Geographical Information Science, 37(5), 1099-1127.
-
Marcial, D. E., Dy, E. D., Maceren, S. F., & Sarno, E. R. (2013).
Artificial neural network-based lot number recognition for cadastral
map. Recent Progress in Data Engineering and Internet Technology:
Volume 1,
-
Memon, J., Sami, M., Khan, R. A., & Uddin, M. (2020). Handwritten
optical character recognition (OCR): A comprehensive systematic
literature review (SLR). IEEE access, 8, 142642-142668.
-
Mikolov, T., Sutskever, I., Chen, K., Corrado, G. S., & Dean, J.
(2013). Distributed representations of words and phrases and their
compositionality. Advances in neural information processing systems,
26.
-
Nishant, R., Kennedy, M., & Corbett, J. (2020). Artificial
intelligence for sustainability: Challenges, opportunities, and a
research agenda. International journal of information management,
53, 102104.
-
Pennington, J., Socher, R., & Manning, C. D. (2014). Glove:
Global vectors for word representation. Proceedings of the 2014
conference on empirical methods in natural language processing
(EMNLP), Doha, Qatar.
-
Peters, M. E., Neumann, M., Zettlemoyer, L., & Yih, W.-t. (2018).
Dissecting contextual word embeddings: Architecture and
representation. arXiv preprint arXiv:1808.08949.
-
Petitpierre, R., & Guhennec, P. (2023). Effective annotation for
the automatic vectorization of cadastral maps. Digital Scholarship
in the Humanities, 38(3), 1227-1237.
-
Rani, D., Kumar, R., & Chauhan, N. (2022). Study and comparision
of vectorization techniques used in text classification. 2022 13th
International Conference on Computing Communication and Networking
Technologies (ICCCNT),
-
Russell, S. J., & Norvig, P. (2016). Artificial intelligence: a
modern approach. Pearson.
-
Saeidian, B., Rajabifard, A., Atazadeh, B., & Kalantari, M.
(2024). Managing underground legal boundaries in 3D-extending the
CityGML standard. Underground Space, 14, 239-262.
-
Vaswani, A. (2017). Attention is all you need. Advances in neural
information processing systems, Long Beach, CA, USA.
-
Williamson, I., Enemark, S., Wallace, J., & Rajabifard, A.
(2010). Land administration for sustainable development. Citeseer.
-
Yıldız, F. B., Ayazlı, İ. E., & Takcı, H. (2021). Generating
temporal cadastral parcels with artificial intelligence algorithms
within the scope of cadastre 2034. Intercontinental Geoinformation
Days, 2, 96-99.
-
Zhou, Z.-H. (2021). Machine learning. Springer nature.
BIOGRAPHICAL NOTES
Hamid Hosseini is a Ph.D. candidate in Geomatics at the University of
Melbourne. He is an active research member of the Centre for Spatial
Data Infrastructures and Land Administration (CSDILA). Hamid’s research
focuses on AI-driven land administration. His research interests involve
GIS, BIM, GeoAI, indoor positioning, 3D Land Administration, and Oracle
Database Administration, with four years of professional experience in
the industry.
Behnam Atazadeh is an ARC DECRA Fellow (Senior Research Fellow) in
the Centre for Spatial Data Infrastructures and Land Administration,
Department of Infrastructure Engineering. He has worked on a wide range
of research and development projects advancing the science and practice
of land administration in Australia and overseas.
Abbas Rajabifard is a Professor and Director of the Centre for
Spatial Data Infrastructures and Land Administration (CSDILA) at the
University of Melbourne. He is also Discipline Leader of Geomatics, and
Leader of the Future Infrastructure Research Program, at the Faculty of
Engineering and IT. Prof. Abbass is an Advisory Board Member of the
United Nations Academic Network Global Geospatial Information Management
(UNGGIM).
CONTACTS
Hamid Hosseini
Department of Infrastructure Engineering, University of Melbourne,
Australia
VIC 3010 AUSTRALIA
Web site:
https://www.linkedin.com/in/hamid-hosseini-01aa57153/
Behnam Atazadeh
Department of Infrastructure Engineering, University of Melbourne,
Australia
VIC 3010 AUSTRALIA
Web site:
https://findanexpert.unimelb.edu.au/profile/653223-behnam-atazadeh
Abbas Rajabifard
Department of Infrastructure Engineering, University of Melbourne,
Australia
VIC 3010 AUSTRALIA


